


- by LiuJiazhu
Does Ebike Adoption Reduce Urban Transportation Emissions?
- by LiuJiazhu
E-Bikes
Shop By Models
Shop By Style
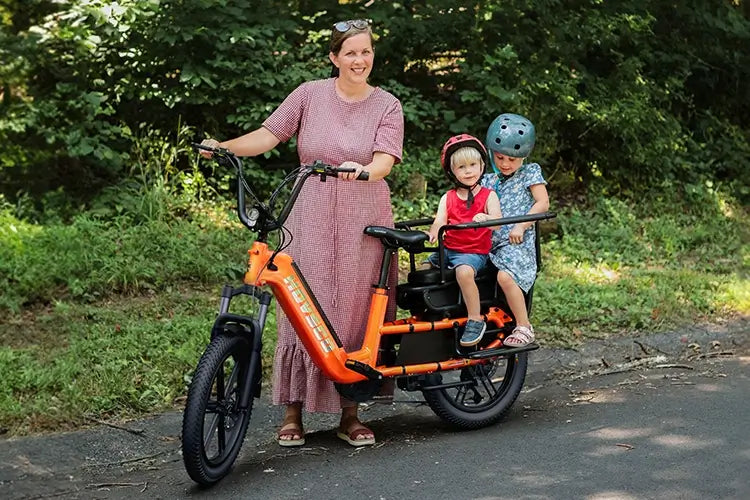
E-bike adoption reduces urban transportation emissions by displacing car trips, cutting CO2, and lowering energy use. E-bikes emit 90% less CO2 per mile than cars and reduce traffic congestion. However, their net impact depends on local electricity sources and usage patterns. For cities prioritizing clean energy, e-bikes offer a scalable, low-emission alternative to fossil fuel vehicles.
E-bikes emit 90% less CO2 per mile than gas cars, with electric motors outperforming combustion engines in energy efficiency. Even compared to EVs, e-bikes use far less energy per passenger-mile.
Beyond direct emissions, e-bikes eliminate tailpipe pollutants like NOx and particulate matter. A typical gas car emits 411 grams of CO2 per mile, while e-bikes average 22 grams—mostly from electricity generation. Practically speaking, replacing a 10-mile daily car commute with an e-bike reduces annual emissions by 1.3 metric tons. But what if your local grid relies on coal? Even then, e-bikes emit 50% less CO2 than hybrids due to their tiny energy draw. For example, charging a 500Wh e-bike battery daily uses the same electricity as a fridge.
| Vehicle | CO2/mile | Energy Use/mile |
|---|---|---|
| Gas Car | 411g | 4,500 Wh |
| E-Bike | 22g | 20 Wh |
Yes—e-bike emissions vary by grid cleanliness. In coal-heavy regions, e-bikes emit 3x more CO2 than in areas with solar/wind. Still, they outperform all gas vehicles.
An e-bike charged via a coal-powered grid emits ~65g CO2/mile—still 84% lower than a gas car. Transitional regions like the EU’s energy mix cut this to 35g, while Nordic countries with 80% renewables drop it to 8g. But why does this gap matter? Cities can amplify e-bikes’ benefits by pairing adoption with grid decarbonization. For instance, Oslo’s e-bike fleet, powered by 98% hydroelectricity, achieves near-zero operational emissions. Conversely, Jakarta’s coal-reliant grid limits reductions but still avoids 12,000 tons of annual CO2 from displaced motorcycle trips.
E-bike manufacturing adds 200-300kg CO2, mainly from battery production, but this is offset within 500 miles of car displacement. Most models break even in 6-12 months.
Lithium-ion batteries account for 40% of an e-bike’s lifecycle emissions. However, recycling programs can reclaim 95% of battery materials, slashing future production footprints. Comparatively, producing one gas car emits 5-10 metric tons of CO2—20x an e-bike’s footprint. Real-world data from Amsterdam shows e-bike riders average 1,800 annual miles, offsetting manufacturing emissions in 4 months. But how durable are e-bikes? Quality models last 5-10 years with proper maintenance, ensuring long-term emission savings.
Yes—e-bikes lower urban heat islands by reducing asphalt demand and cut noise pollution, which indirectly supports emission-reducing behaviors like outdoor dining.
Compact e-bike parking (1/10th the space of cars) enables cities to replace parking lots with green spaces, which sequester CO2. Portland’s e-bike corridors increased tree canopy by 15% post-2020. Noise reduction also matters: Quieter streets improve sleep and productivity, reducing energy use from HVAC systems. Imagine replacing 100 cars with e-bikes—this frees 3,000 sq ft of land for urban farms absorbing 1 ton of CO2 annually.
| Benefit | E-Bike Impact | Car Equivalent |
|---|---|---|
| Space Efficiency | 10 bikes/parking spot | 1 car/spot |
| Noise Pollution | 60 dB | 75 dB |
Yes—e-bikes solve the “last-mile problem”, boosting transit ridership by 25% in cities like Berlin. Integrated systems cut total commute emissions by 50% versus solo driving.
When paired with trains or buses, e-bikes extend viable transit ranges from 5 to 15 miles. Tokyo’s rail stations saw 30% higher ridership after adding e-bike shares. Why? Commuters avoid energy-intensive short car trips to stations. A UC Davis study found e-bike/transit users emit 65% less CO2 than car commuters. Cities like Vienna offer discounted transit passes for e-bike owners, creating a 18% mode shift from cars.
Subsidies, bike lanes, and charging infrastructure can triple e-bike adoption rates. France’s €4,000 e-bike incentive cut transport emissions by 4% in two years.
Tax rebates covering 30% of e-bike costs have proven effective in Norway, where 35% of urban trips are now e-bike-based. Dedicated lanes also matter: Protected bike corridors in Barcelona increased e-bike speeds by 20%, making them faster than cars in 70% of routes. But what about freight? Cities like London exempt e-cargo bikes from congestion taxes, slashing delivery van emissions by 60%.
Yes—e-bikes emit 50-70% less CO2 than hybrids even on coal grids, thanks to ultra-low energy needs (20-30 Wh/mile).
Are e-bike batteries worse for emissions than driving?No—battery emissions are offset within 500 miles. Most riders achieve this in 6 months, ensuring long-term net reductions.
Do e-bikes reduce traffic congestion emissions?Yes—1 e-bike replaces 3 car trips on average, cutting idling emissions by 40% in cities like Seattle.
Share:
What Are the Best Affordable Electric Bikes Under $2000 for City Riding?
Are Folding Electric Bicycles Practical For Urban Commuting?